 By Julio Díaz García, Sapienx Automation.
The Problem
Security is a critical factor in any building control system and, in my opinion, should be the primary design consideration in a KNX installation. Furthermore, the decentralised nature of a KNX bus system requires, on many occasions, the cyclical monitoring of signals, and that may affect their security. For example: wind alarms are monitored to control awnings and blinds because, in the absence of these signals, serious consequences may occur on site. Another example is that a temperature signal from an external sensor may be cyclically monitored by a room thermostat in order to avoid unnecessary energy consumption if the sensor fails.
The cyclical monitoring of certain signals however, does not solve all of the possible problems in a KNX installation. KNX devices themselves may be affected by multiple types of incidents: theft, damage (rare, but possible), bus cable cutting, power failures, etc.
Therefore, monitoring of the devices themselves is needed in KNX installations where an optimum level of security is desired. This monitoring, which is done through the individual addresses, also enables us to check the traceability of the bus, and can be helpful to precisely locate not only any particular effect, but also more significant failures, such as power failure in a whole line, or a possible cut in the bus that will affect multiple devices.
The Solution
To perform monitoring of individual addresses from a KNX installation, external help is needed. In my article for the November 2015 issue, the advantages of using the NETxAutomation BMS Server for integrating multiple lines via KNX IP were shown. For the purposes of this article, we will again use the NETxAutomation BMS Server for monitoring devices in a KNX installation.
We will also use a visualisation tool, the Voyager 5.0 OPC from NETxAutomation, to simulate the bus traceability. That is, we will simulate the bus cable laying of one line, allowing us to interpret whether any errors are individual types (due to burglary, connection failure, breakdown, etc.) or group (cut on the bus, power failure of the line, etc.).
Monitoring Physical Addresses
After installing the BMS Server, the steps for configuring the monitoring of the physical addresses are very simple. First, we need to extract data from the ETS project using the NETx BMS App (see the November 2015 article).
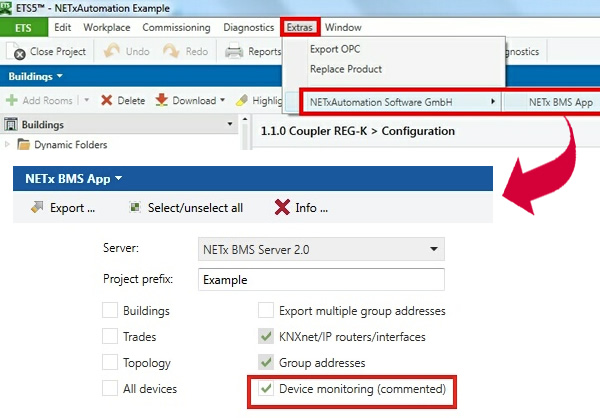
NOTE: Both the NETxAutomation BMS Server and Voyager 5.0 are available for download (30-day demo version) from www.netxautomation.com. The NETx BMS App for ETS4 and ETS5 is free and can be downloaded from here.
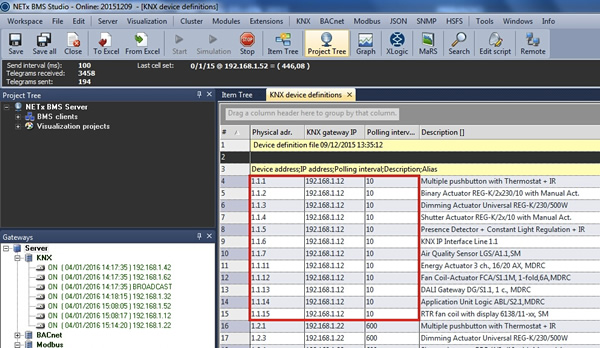
Once the Project has been imported in the BMS Server, we can appreciate the ‘KNX Device Definitions’ table with the ‘mapping’ of the individual addresses (allocated to each line – IP address). In the following example, you can see this table, where we assigned a 10-second polling for Line 1.1. devices.
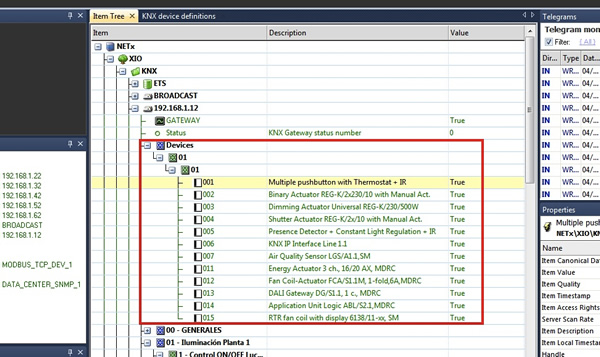
Also, the item tree in the image below shows us that all devices on Line 1.1 respond positively to the polling, by showing a TRUE state.
Although the information displayed by the item tree is very valuable to assess the health of each individual device, it is not enough to give a complete traceability of the installation. To supplement this information it is recommended to visually capture the physical layout of the devices as well as the laying of the bus. The following is an example of this visualisation.

Examples of Device Failure
Finally, we will see two examples of possible failures in physical devices, to evaluate the usefulness of the proposed solution.
1) Error in a single device
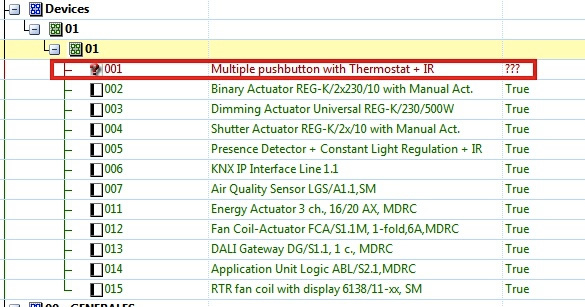
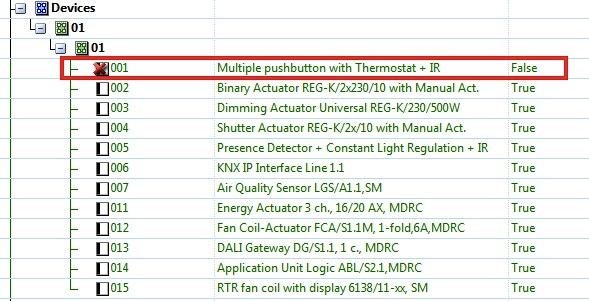
In this case we have disconnected the device 1.1.1 from the bus. The following images show the device in an undefined (???) state, first in the item tree and then in the visualisation.
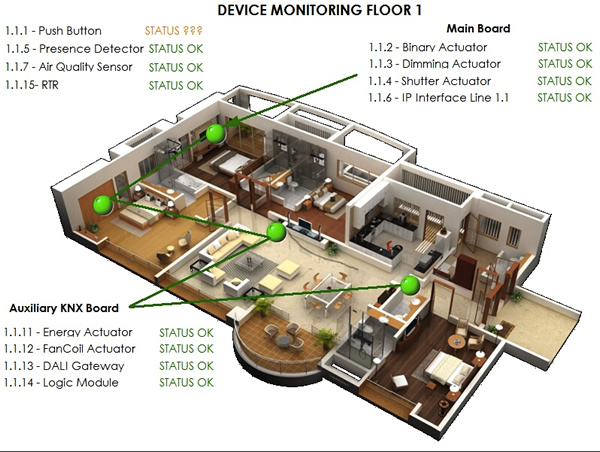
After a (courtesy) timeout, finally the item tree in the BMS Server shows the device in FALSE state. At this point, we could, for example, set an automatic email warning about this device failure from the BMS Server.

2) Simultaneous error in a group of devices
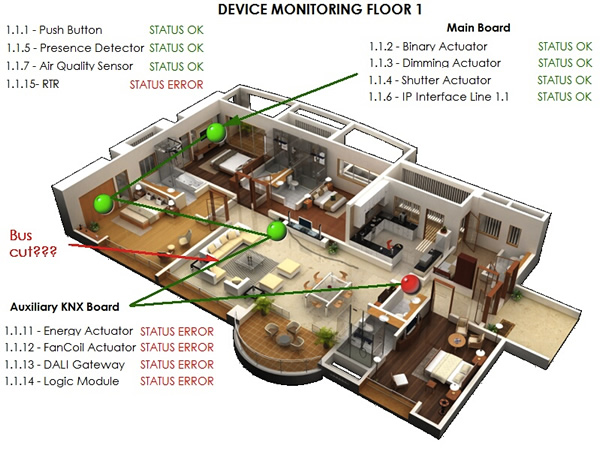
In this case we have simulated a cut in the wire bus, forcing the shutdown of bus devices 1.1.11 to 1.1.15. As shown in the examples below, both the item tree and the visualisation show all of these devices in an undefined (???) state.
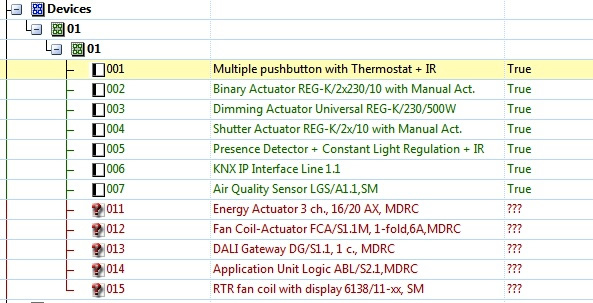
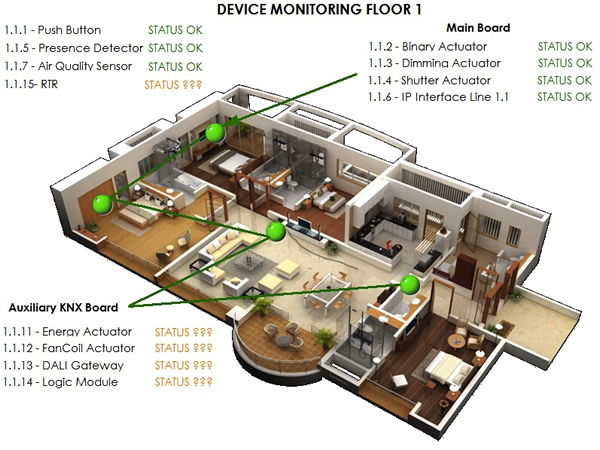
Finally, after the timeout, the five devices go to FALSE status.
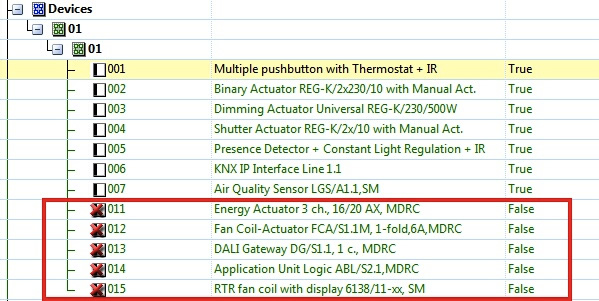
In the visualisation, we can see the location of all the five devices that are have a FALSE status. From this, we can infer, as one of the most likely causes of the failure, a bus break between the 1.1.7 device and the KNX Auxiliary Board.
Conclusion
Supervision of individual addresses in a KNX system allows us to optimise the level of security. To perform this monitoring, it is necessary to use an external (software) tool to undertake continuous sampling or polling of devices. This will also allow us, in combination with a visualisation of the KNX device’s location and the laying of the bus, to quickly identify the detected problems, and analyse them for possible causes.
Julio Díaz García is the Owner of Sapienx Automation. He is an Engineer and KNX International Award-winning KNX++ Tutor. Sapienx Automation provides engineering, training and consultancy services for smart buildings, smart metering and smart cities.